
Exploring Renewable Energy Opportunities in Select Southeast Asian Countries
Costs for generating electricity from renewable energy sources have fallen to levels that are increasingly competitive with traditional sources of electricity generation, such as fossil fuels. As these costs fall, private developers, policymakers, and energy system planners are searching for opportunities to harness high-quality renewable energy resources.
Developing economies are setting ambitious targets and exploring how cost-effective, grid-connected renewable energy options can help power economic growth and meet growing electricity demands.
This analysis, and the complementary Cost of Energy Mapping Tool on Renewable Energy (RE) Data Explorer, were developed to help policymakers, planners, private developers, and other actors in Southeast Asia assess the cost of utility-scale wind and solar photovoltaics (PV) development. Users can interactively explore the results of this analysis on RE Data Explorer to inform renewable energy decisions in their countries.
The U.S. Agency for International Development (USAID) and the U.S. Department of Energy's National Renewable Energy Laboratory (NREL), via the USAID-NREL Partnership, developed the analysis and tool in collaboration with the USAID Clean Power Asia program and the ASEAN Centre for Energy (ACE).
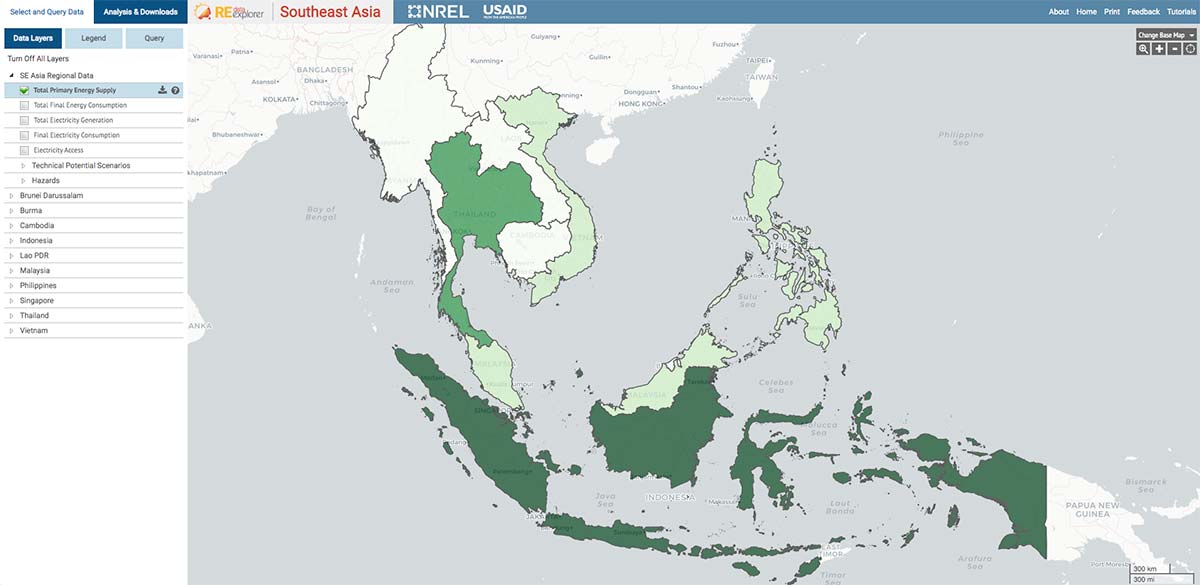
The map below (Figure 1) highlights the countries presented in the analysis and where the interactive Cost of Energy Mapping Tool can be used to assess the costs of renewable energy development. The various shades of green (and white) depict the Total Primary Energy Supply, which is equivalent to total primary energy demand and represents domestic demand for energy commodities that are either extracted or captured directly from natural resources (e.g., crude oil, coal, natural gas, or hydro) or imported/exported energy commodities (e.g., electricity or heat). White represents the lowest level of Total Primary Energy Supply, and dark green represents the highest level.
Figure 1. Map of select Southeast Asia countries included in this analysis from RE Data Explorer, showing Total Primary Energy Supply.
Launch the tool to do your own analysis.
What is the motivation for this work?
Collectively, the Association of Southeast Asian Nations (ASEAN) is aiming to reach a target of 23% renewable energy in the region's total energy supply by 2025. However, a lack of quality data and analyses to support renewable energy investment and deployment decisions presents a critical gap to achieving this target in the countries of Southeast Asia.
To help address this gap, the Cost of Energy Mapping Tool on the RE Data Explorer platform provides high-quality data and spatial analysis of the cost of utility-scale solar PV and wind generation in Southeast Asian member states. It allows users to visually explore (or download) estimated costs and develop additional scenarios by modifying techno-economic input assumptions. Box 1 highlights some of the capabilities of the RE Data Explorer and Cost of Energy Mapping Tool. Building on this tool, the analysis presented here provides an in-depth look at the cost of utility-scale wind and solar PV generation across the ASEAN member states. This information can then be used by investors and decision-makers to enable deployment.
The goals of this analysis for the ASEAN member states, specifically, are to:
- Improve access to data and tools for energy decision-making.
- Demonstrate the capabilities and constraints of the Cost of Energy Mapping Tool and increase awareness and use of the tool to estimate generation costs for wind and solar PV.
- Estimate the costs of renewable energy generation across Southeast Asian countries to support early-stage renewable energy target setting, power sector planning, policymaking, and investment in the region.
Within the tool and analysis, generation costs are expressed as the levelized cost of energy (LCOE). This commonly used metric represents the net present value of the unit cost of electricity during the lifetime of a particular generation technology—allowing for a comparison of different generating technologies.
The Cost of Energy Mapping Tool and related analysis provide the first spatial and interactive representation of LCOE for renewables in Southeast Asia. These knowledge products will help enable Southeast Asian countries to meet their ambitious renewable energy goals while also supporting critical development objectives.
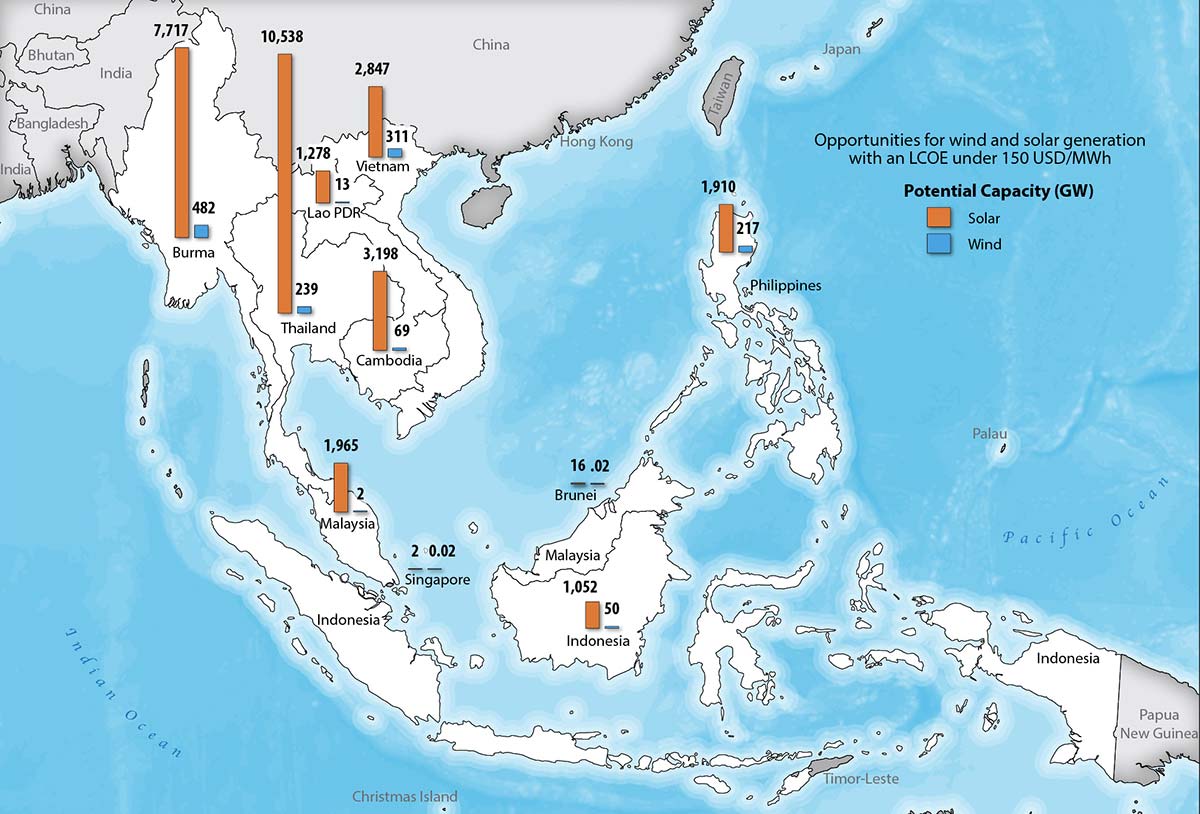
Figure 2 shows the cumulative solar PV and wind opportunities (capacity in GW) potentially available in each Southeast Asian country with an LCOE of less than $150 USD/MWh estimated in this analysis.
Figure 2. Cumulative solar PV and wind opportunities (capacity in GW) potentially available at an LCOE of less than $150 USD/MWh in the ASEAN member states.
Box 1. Renewable Energy Data Explorer
Reliable, robust, and validated data are critical for informed, data-driven planning, policy development, and investment in the clean energy sector. RE Data Explorer is a user-friendly, no-cost, flagship online geospatial analysis tool for analyzing renewable energy potential and informing decisions. Developed by the National Renewable Energy Laboratory (NREL) and supported by the U.S. Agency for International Development (USAID), RE Data Explorer performs visualization and analysis of renewable energy potential for customizable, user-defined scenarios.
RE Data Explorer was developed to support data-driven renewable energy analyses and decisions that enable ambitious, cost-effective, and achievable outcomes for renewable energy deployment. RE Data Explorer can support prospecting, integrated planning, policymaking, and other decision-making activities to accelerate renewable energy deployment. In addition to renewable energy resource data, other complementary, modeled, or measured geospatial data layers play an important role in decision-making. These data layers include land use, weather data, population density, and the location of existing transmission lines, among others.
RE Data Explorer users can visually explore spatial renewable energy resources and complementary spatial data sets, complete technical potential analyses (via the Technical Potential Tool), and LCOE estimates for wind and solar PV technologies with the Cost of Energy Mapping Tool. Users can replicate the scenarios presented in this work and develop new scenarios for specific countries to visually explore (or download) the results for additional analyses.
Cost of Energy Mapping Tool in the RE Data Explorer
How is this analysis useful for decision-makers?
This analysis provides useful results and demonstrates the spatially resolved LCOE methodology and Cost of Energy Mapping Tool for a variety of audiences:
Policymakers and planners
- Support policymaking, planning, and target setting at the national and regional levels with an estimate of the available cost-effective energy resources given regionally specific assumptions and inputs.
- Aid in identifying favorable sites for on-the-ground resource measurement and validation for renewable energy auctions and/or early-stage proactive transmission planning approaches (such as the renewable energy zone transmission planning process).
- Identify potential barriers to energy investment in Southeast Asia—including land-use or development constraints, generation technology installed costs, and discount rates.
- Provide a methodology and tool to conduct future LCOE analyses with updated technology costs and other assumptions.
Developers, utilities, and investors
- Help identify areas that may have attractive wind and/or solar PV generation costs that could warrant more detailed project feasibility studies.
- Identify potential barriers to investment and possible levers that developers may be able to address to make renewable energy projects more appealing for investment.
Other actors—including donor agencies, development banks, and development partners
- Demonstrate the capabilities of the Cost of Energy Mapping Tool and the spatial methodology to estimate LCOE to increase awareness and use of the tool to support energy policymaking and planning activities.
How do we estimate the cost of generation?
The cost of generation is estimated through a calculation of the LCOE, a metric that:
- Measures the lifetime costs of a generator divided by its energy production; and
- Allows for comparisons of different technologies (e.g., wind, solar PV, natural gas, fossil fuels) of unequal lifespans, project size, different capital costs, risks, returns, and capacities.
Calculating LCOE is a key step in estimating economic potential. LCOE provides a "breakeven" price of power that would cover a generator's lifetime costs and embeds engineering and economic assumptions.
This analysis combines geospatial analysis tools and the LCOE calculation methodology established in NREL's Annual Technology Database. LCOE is calculated on a 1-km-by-1-km grid using capacity factors determined from a set of technical potential scenarios for both solar PV and wind.
Results are limited to locations with net capacity factors greater than 10% for solar PV and 15% for wind, as locations with lower-quality resources have a higher cost per unit of energy produced and are less likely to be developed.
For a detailed list of how this work can be applied to assess the cost of utility-scale renewables, see the full report, page 7. For more information on how these estimates were calculated, see the full report, Page 45.
Where did we collect the data?
The economic and techno-economic data and assumptions for calculating LCOE, such as installed costs and interest rates, were collected and estimated by NREL and ACE with support from the USAID Clean Power Asia program. Where available, data and assumptions were based on country-specific project data; however, publicly available values from in-country and international sources were used when no country-specific project data were available. Project-specific data were aggregated by country to ensure all proprietary data remained anonymous.
To account for recent trends in the cost of renewables, techno-economic data (such as installed costs for solar PV and wind) were limited to values from between 2015 and 2018. Older project data were filtered out to minimize the impacts of inflation, exchange rates, and declines in the costs of renewables on estimated LCOE results.
To further refine LCOE estimates and support decision-making, economic and techno-economic assumptions (such as installed and operation and maintenance [O&M] costs) should be updated when data become available. Further studies, long-term data measurement, and validation activities are essential to confirm resource availability or project performance for policy, planning, or project development.
For more information on the data used in calculating the LCOE, see the full report, Appendix A-1.3.1 LCOE Data Collection.
What did we not include in this analysis?
It is important to note that LCOE does not reflect all of the considerations that can impact the economics of a particular project and represents only a step in the calculation of the economic potential of an area. For example, the LCOE does not consider seasonal and daily variability in generation from solar PV and wind resources. This means the estimates do not reflect either the economic benefits when a generator produces electricity during peak demand hours or the losses in revenue due to curtailment during periods of overproduction.
This work presents broad trends in LCOE for Southeast Asia. It does not attempt to calculate the actual cost of generation at any location. The results are not definitive and should not be used for specific project siting or be adopted into policies without further detailed analyses.
For a detailed list of this work's limitations, see the full report, page 8.
How did we estimate the technical potential for solar PV and wind in Southeast Asia?
Countries in Southeast Asia have abundant renewable energy resource potential. This resource potential represents the theoretical, upper bound of renewable energy resource available at a given location—not considering technical or economic constraints to development (such as land-use constraints). The resource potential is further constrained when calculating the technical and economic potential of a given region. Figure 3 illustrates how the resource, technical, and economic potential inform one another.
Figure 3. Categories of renewable energy potential.
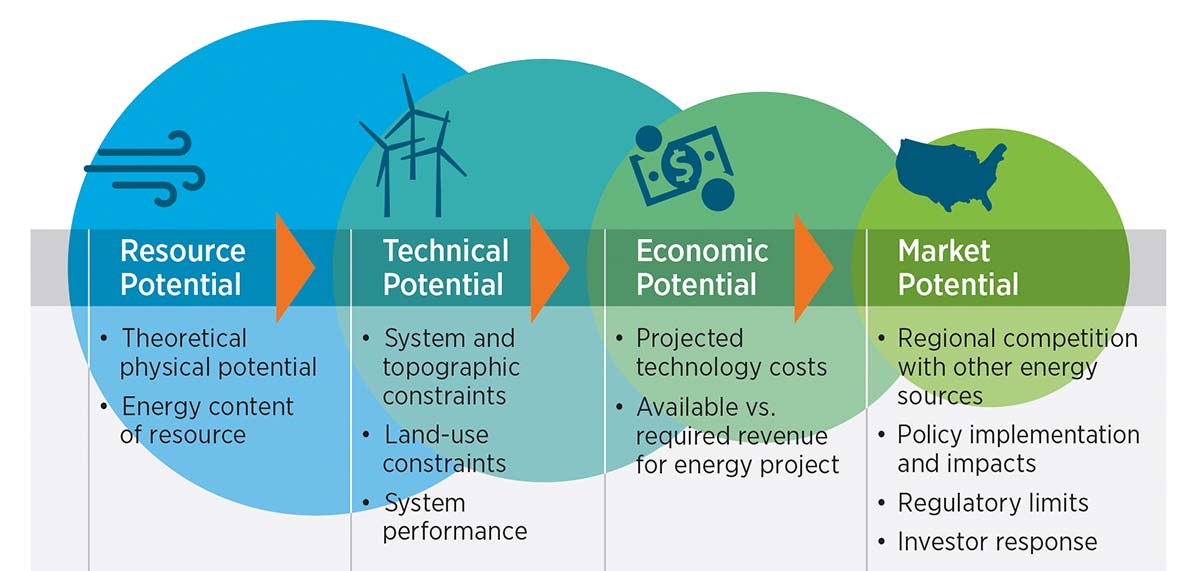
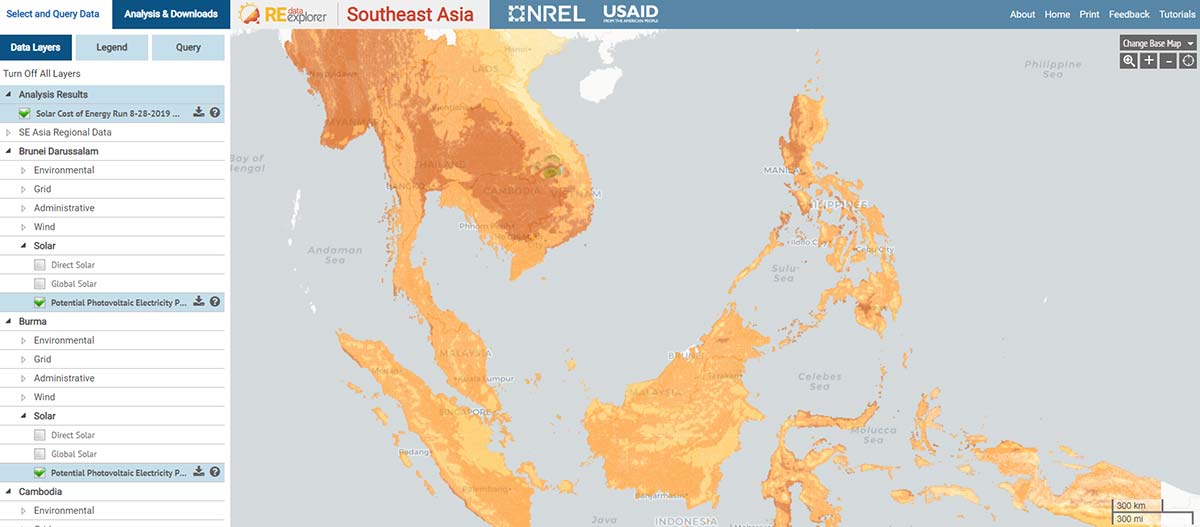
Figure 4 shows the resource potential for solar PV in Southeast Asia, and Figure 5 shows the potential for wind. Darker colors in the figures correspond to higher resource potentials (higher irradiance in the case of solar and higher wind speeds in the case of wind). Although abundant resources exist, the actual technical and economic potential of these resources depends on multiple factors. This work builds on the region's renewable energy resource potential to estimate the LCOE of utility-scale, land-based wind and solar PV generation. Users can click on the maps below to access RE Data Explorer and explore these resource potentials in more detail.
Source: NREL with solar resource data from World Bank (2017)
Figure 4. Solar resource potentials across Southeast Asia.
Launch the tool to do your own analysis.
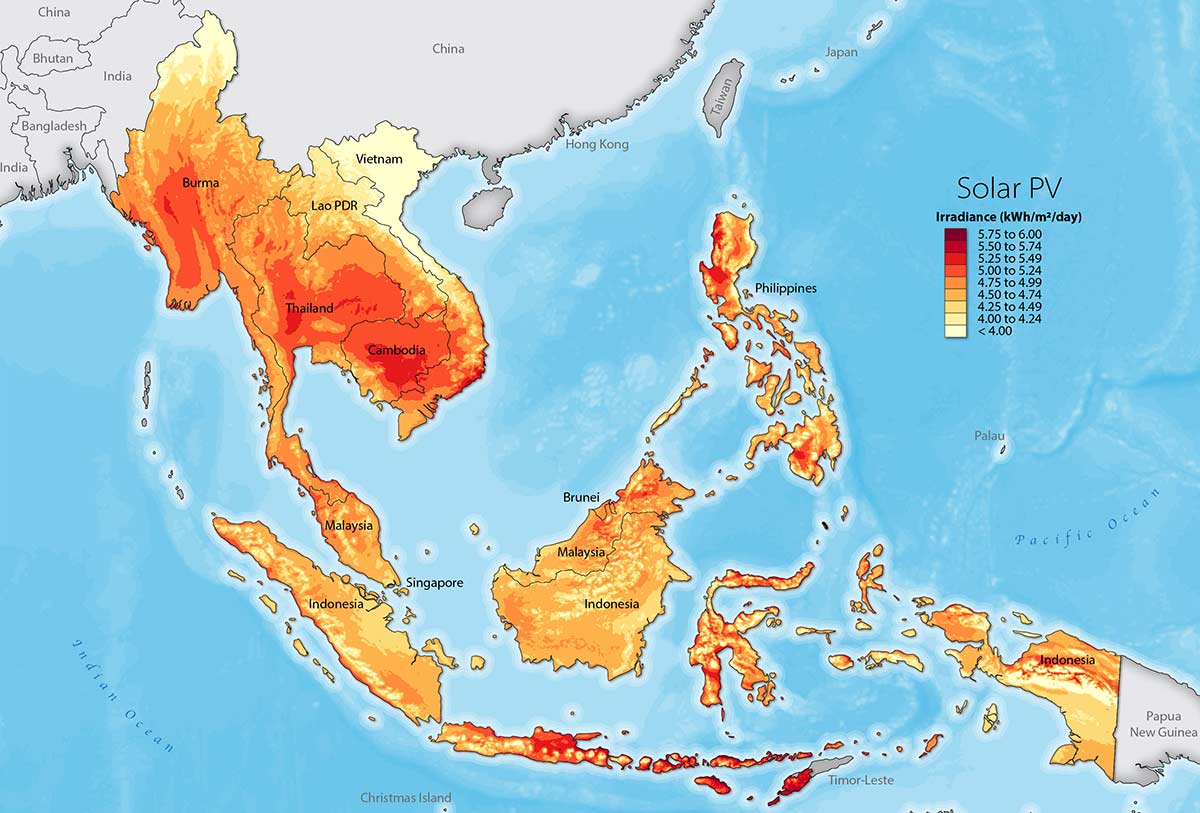
Figure 5. Wind resource potentials across Southeast Asia.
Launch the tool to do your own analysis.
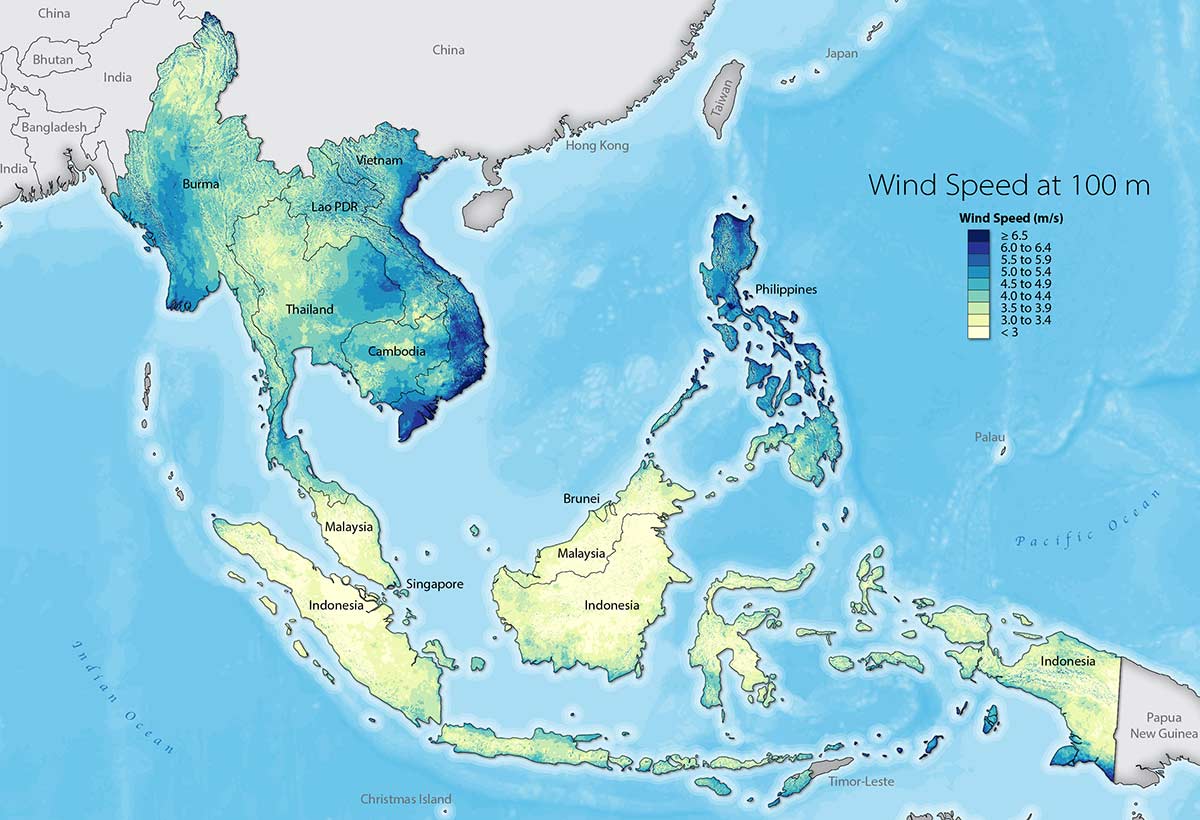
Source: NREL with wind resource data from the Danish Technical University (2017)
Although abundant solar and wind resources exist, the actual technical and economic potential of these resources depends on multiple factors. Technical potential is a subset of the resource potential that represents the capacity (MW), generation (GWh), and suitable land area (km2) that are feasible for development. It reflects the reality that not all physically available solar and wind resources are developable due to technological or land-use constraints.
This work builds on the region's resource potential to estimate the LCOE of solar PV and wind generation within a set of technical potential scenarios. A technical potential scenario is a predefined set of assumptions that establishes the constraints for development for each generation technology. These scenarios define the sites on which development of a particular technology is technically feasible and excludes areas with constraints to developing renewable energy generation in particular areas.
For details on the technical potential scenarios considered in this work, see Appendix A-1.2 from the full report, page 46.
Box 2. Technical Potential Scenarios for Select Southeast Asian Countries
The technical potential scenarios considered in this work for utility-scale solar PV and land-based wind in Southeast Asia are presented in Tables 1 and 2, respectively. These scenarios were developed in coordination with ACE and ACE’s Renewable Energy Sub Sectoral Network (RE SSN) Focal Points.
For example, for solar PV (Table 1), in the "Relaxed" technical potential scenario, all protected areas, water bodies, and urban areas are excluded from consideration while forested areas, agricultural areas, and areas with any slope are considered (or included). The third, "Restricted," scenario further excludes forested areas, agricultural areas, and areas with a slope greater than 5%.
| Scenario | Protected Areas | Water-bodies | Forested Areas | Urban Areas | Agricultural Areas | Slope Exclusion |
|---|---|---|---|---|---|---|
| Relaxed | Exclude | Exclude | Include | Exclude | Include | None |
| Moderate | Exclude | Exclude | Exclude | Exclude | Include | > 5% Slope |
| Restricted | Exclude | Exclude | Exclude | Exclude | Exclude | > 5% Slope |
| Urban Emphasis | Exclude | Exclude | Exclude | Include | Exclude | > 3% Slope |
| Scenario | Protected Areas | Water-bodies | Forested Areas | Urban Areas | Agricultural Areas | Slope Exclusion |
|---|---|---|---|---|---|---|
| Relaxed | Exclude | Exclude | Include | Exclude | Include | None |
| Moderate | Exclude | Exclude | Exclude | Exclude | Include | > 20% Slope |
| Restricted | Exclude | Exclude | Exclude | Exclude | Exclude | > 20% Slope |