
Diving into Results—Solar PV and Wind Costs in Southeast Asia
What is the cost of utility-scale solar PV generation in select Southeast Asian countries?
The cost of generation for utility-scale renewables across Southeast Asia depends on multiple factors that are often specific to each country, such as resource availability and quality, installed costs, O&M costs, and financial considerations. (Appendix A-1.3 of the full report provides a complete list of inputs.)
Figure 6 shows the variations in LCOE for Solar PV within the Moderate Technical Potential Scenario and with a capacity factor of more than 10%. In this scenario, the LCOE ranges from $64 USD/MWh in Vietnam to more than $200 USD/MWh in Indonesia. Users can click on the map below to be taken to the Cost of Energy Mapping Tool to explore these costs in more detail and to further define targeted scenarios.
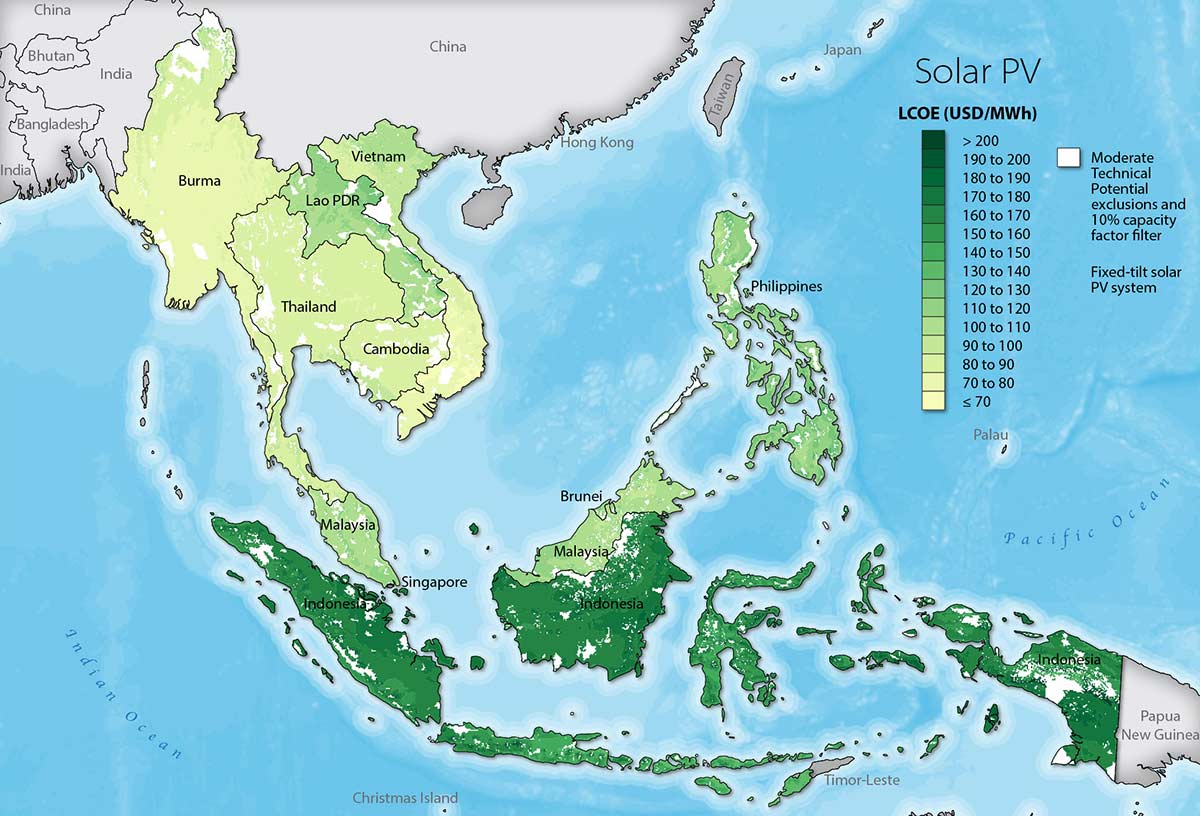
Variations in the LCOE for solar PV result both from changes in energy resource quality (capacity factor), with lower LCOE values associated with high resource quality, and from changes in economic (e.g., inflation and tax rates) and techno-economic (e.g., installation and O&M costs) assumptions across countries. Distinct changes in LCOE along country borders (e.g., between Thailand and Lao PDR) result from country-specific economic and techno-economic assumptions—not from distinct changes in resource quality, which is relatively contiguous along the borders. Intra-country variations are smoother and result from variations in the solar energy resource quality, because economic and techno-economic assumptions are constant across each country.
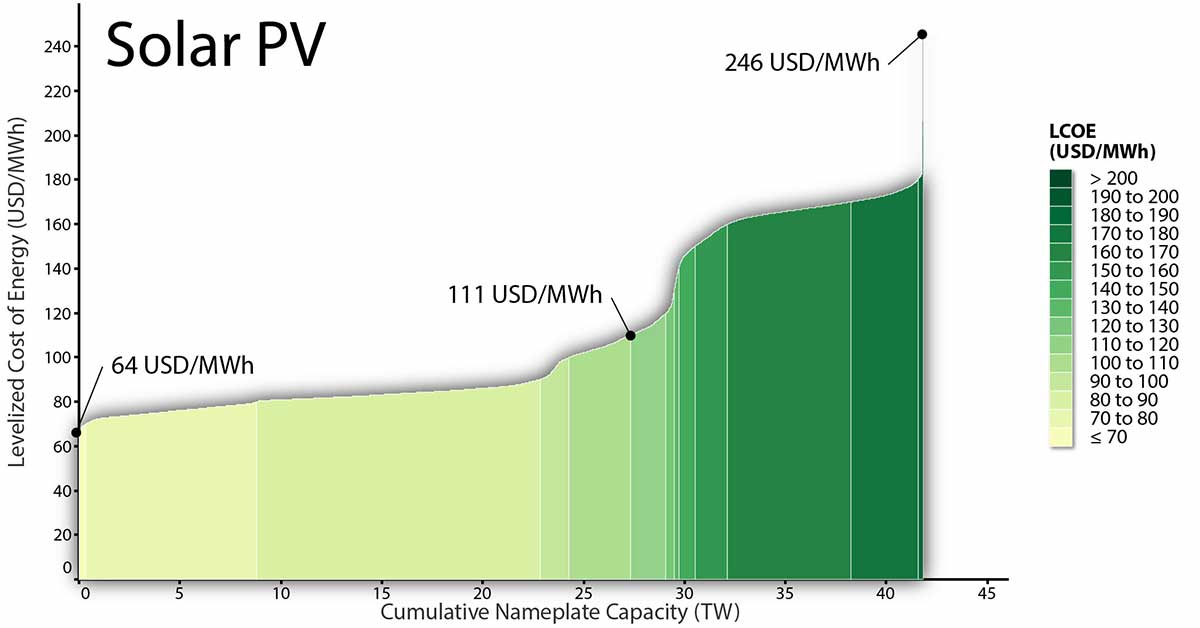
Supply curves can help to quantify the cumulative capacity of solar PV that can be developed for a maximum cost, or minimum capacity factor, in a region. On its vertical axis, the supply curve shows the LCOE of each unit of energy produced by potential generators sited in each area. On its horizontal axis, a supply curve shows the total potential cumulative installed capacity (MW) equal to or less than a given LCOE.
Figure 7 shows that the total potential cumulative installed capacity from solar PV available across all Southeast Asia for an LCOE equal to or less than $246 USD/MWh—corresponding to a minimum capacity factor of 10% in the region—is approximately 42 TW (Moderate Technical Potential Scenario). The minimum LCOE in the region is $64 USD/MWh, and the median LCOE for the region is $111 USD/MWh. The ranges in this supply curve correspond to the colors mapped across Southeast Asia in Figure 6.
Figure 7. Solar PV supply curve for Southeast Asia—Moderate Technical Potential Scenario.
For more information about the cost of solar PV generation in Southeast Asia, see the full report, section 2.1.1, page 10.
What is the cost of utility-scale wind generation in Southeast Asia?
The cost of generation for utility-scale renewables across Southeast Asia depends on multiple factors that are often specific to each country, such as resource availability and quality, installed costs, O&M costs, and financial considerations. (Appendix A-1.3 of the full report provides a complete list of inputs.)
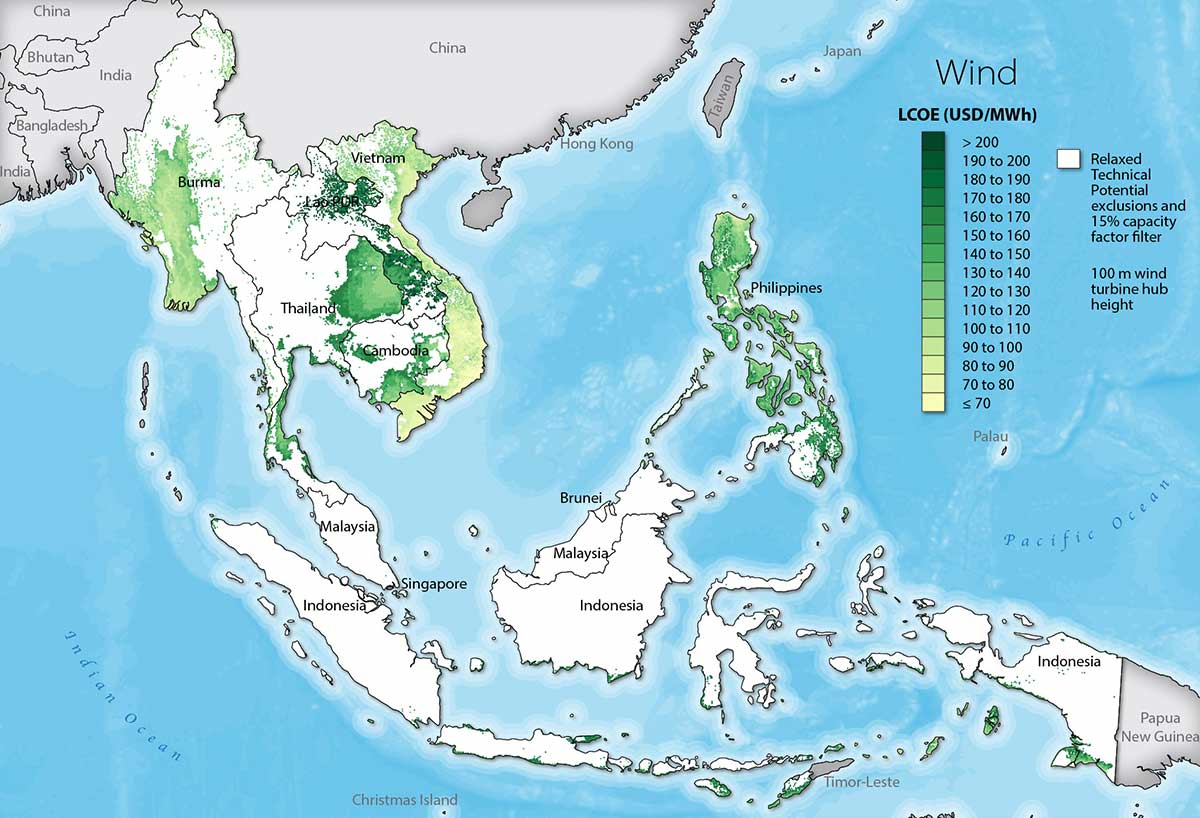
Figure 8 shows the estimated LCOE for wind within the Moderate Technical Potential Scenario. In this scenario, estimated LCOEs for wind range from approximately $42 USD/MWh in Vietnam to more than $200 USD/MWh in Lao PDR. Figure 8 also shows that a significant amount of area in the region is excluded (colored white) as a result of the wind resource quality filter, which excludes areas with capacity factors of 15% or less. These areas would not typically be appealing for commercial development. Users can click on the map below to be taken to the Cost of Energy Mapping Tool to explore these costs in more detail and to further define targeted scenarios.
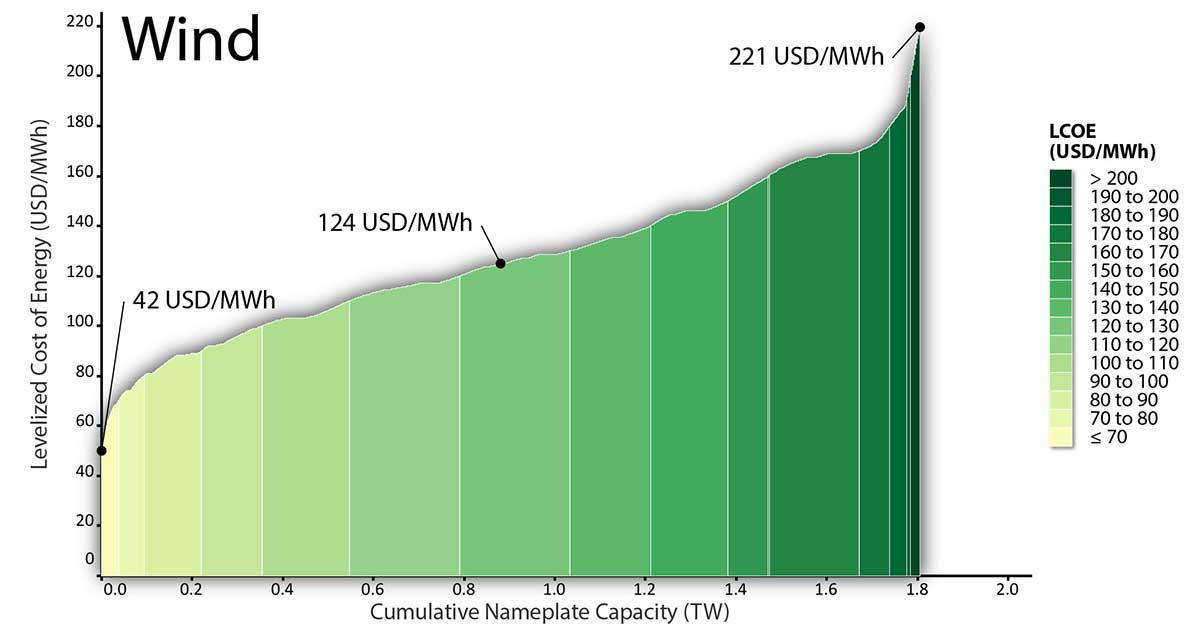
The supply curve in Figure 9 shows that the estimated cumulative potential for installed wind capacity across the region is at or below $221 USD/MWh, which is approximately 2 TW for the Moderate Technical Potential Scenario. The minimum LCOE for wind in the region is $42 USD/MWh and the median LCOE is $124 USD/MWh. The colors depicted in this supply curve correspond to the color ranges mapped across Southeast Asia in Figure 8.
Figure 9. Wind supply curve for Southeast Asia—Moderate Technical Potential Scenario.
For more information about the cost of wind generation in Southeast Asia, see the full report, section 2.1.2, page 13.
Key Takeaways for Generation Costs Across Select Southeast Asian Countries
- The LCOE for solar PV and wind varies significantly across the ASEAN member states.
- The existence of high-quality solar and wind energy resources plays a significant role in the estimated cost per unit of generation.
- For the Moderate Technical Potential Scenario, solar PV LCOEs range from $64 to $246 USD/MWh, with an estimated 42 TW of cumulative potential capacity available within this LCOE range for solar PV.
- For the Moderate Technical Potential Scenario, wind LCOEs range from $42 to $221 USD/MWh, with an estimated 1.8 TW of cumulative potential capacity available within this LCOE range for land-based wind.
- Wind resources, in particular, are not equitably distributed across the region and significant areas are excluded in this study because of lower-quality resources, which would not typically be appealing for commercial development.
How do land-use constraints affect the cost of generation?
With economic development, population growth, and increased demand for resources, competing demand for land use will likely rise. Land-use designation policies that establish the areas where renewables can be developed often impact the feasible areas considered by developers and the resulting generation costs. Decision-makers must frequently consider trade-offs between land-use designations that may support energy system expansion and land uses that support other development objectives (such as agricultural land or forests).
To explore the impact land-use constraints for solar PV and wind development may have on LCOE, additional technical potential constraint scenarios were developed. These scenarios represent progressively restrictive exclusions for potential solar PV and wind development. In general, the suitable land area (km2), potential capacity (MW), and generation (GWh) available decrease as more constraints (i.e., exclusions) are added to development. Additional details on the technical potential scenarios for wind and solar PV are available in Box 2.
Solar PV
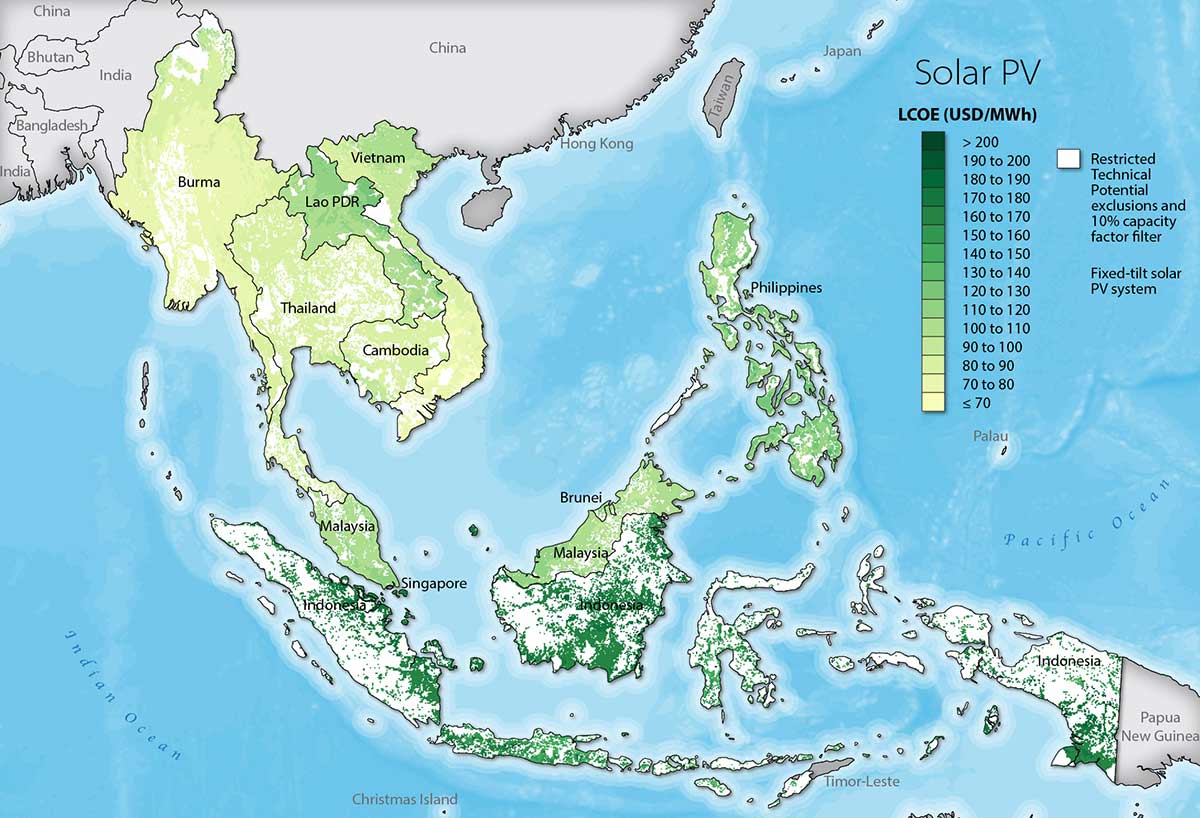
The Relaxed Technical Potential Scenario results in the most suitable area (km2) for solar PV development and potential capacity (MW) across the region due to fewer constraints to development. The cumulative potential capacity across the region in the Relaxed Technical Potential Scenario is approximately 134 TW ( Figure 10). The cumulative potential capacity in the Moderate Scenario is approximately 42 TW ( Figure 7). The Restricted Scenario, with the most constraints to development, has a regional cumulative capacity of approximately 6 TW ( Figure 8).
Figure 10. Solar PV LCOE across Southeast Asia—Relaxed Technical Potential Scenario.
Launch the tool to do your own analysis.
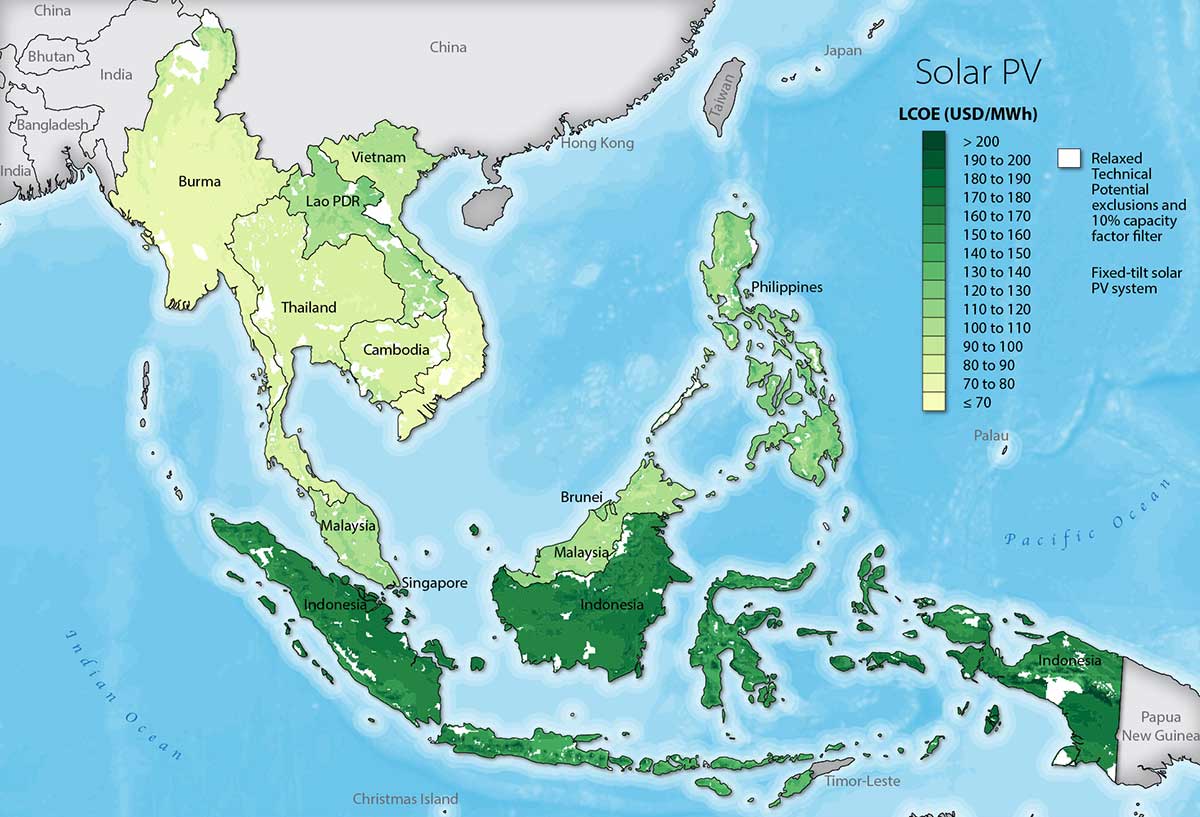
Figure 11. Solar PV LCOE across Southeast Asia—Restricted Technical Potential Scenario.
Launch the tool to do your own analysis.
The average LCOE for solar PV in each country does not vary significantly among the three technical potential scenarios (see the full report, Table 3). The consistent average LCOE suggests that land area (and resources) are excluded equitably among regions of different LCOE levels.
Box 3. Assessing LCOE of Solar PV in Urban Areas
Typically, technical potential scenarios exclude urban areas that are too densely developed for the siting of utility-scale generation. In the preceding sections, all technical potential scenarios excluded urban areas. However, to highlight potential use cases of the Cost of Energy Mapping Tool (see Box 1), this work also includes an urban scenario for solar PV, which assesses the LCOE of solar PV only within urban areas. The purpose is to explore the potential LCOE around population centers—regions where significant energy demand likely exists (not to compare with other scenarios). An estimate of LCOE in urban areas could inform distributed solar PV and rooftop solar PV development because generation in dense urban areas would likely not be utility scale.
The average LCOEs for the Urban Scenario are shown in Table 3 of the full report, and technical potential results are shown in Table B-1 in Appendix B of the full report.
As an example of the LCOE results for urban areas, the figure below shows the spatial LCOE results for the Hanoi Metropolitan Area in Vietnam. The LCOE range for a significant share of the Hanoi metropolitan area is from $95 to $99 USD/MWh. Higher LCOEs, which result purely from lower solar resource quality, from approximately $95 to $105 USD/MWh, are seen around the Hanoi city center. LCOEs in the range of $105 to $110 USD/MWh are seen around the periphery of Hanoi. Users can click on the map below to be taken to the Cost of Energy Mapping Tool to explore these costs in more detail and to further define targeted scenarios.
Solar PV LCOE for Hanoi Metropolitan Area, Vietnam, for Urban Technical Potential Scenario
Wind
As with solar PV, the suitable land area (km2) available for wind is influenced by the addition or removal of development constraints—and, with less available land area for wind development, the potential installed capacity is reduced. The cumulative potential capacity across the region in the Relaxed Technical Potential Scenario is approximately 30 TW ( Figure 12). The cumulative potential capacity in the Moderate Scenario is approximately 19 TW ( Figure 9). The Restricted Scenario has a regional cumulative capacity of approximately 4 TW ( Figure 13). With a reduction of potential capacity, especially in regions with high capacity factors, the estimated generation (GWh) also falls across the region. Table B-2 in Appendix B of the full report presents the technical potential results (i.e., suitable land area, capacity, and generation) within the available LCOE ranges for each of the technical potential scenarios considered for wind.
Figure 12. Wind LCOE across Southeast Asia—Relaxed Technical Potential Scenario.
Launch the tool to do your own analysis.
Figure 13. Wind LCOE across Southeast Asia—Restricted Technical Potential Scenario.
Launch the tool to do your own analysis.
As with Solar PV, the average LCOE for wind in each country does not vary significantly among the three technical potential scenarios (see the full report, Table 4). The consistent average LCOE suggests a fairly consistent resource quality within each country as areas are progressively excluded from development within the scenarios considered.
Key Takeaways for Assessing How Land-Use Constraints Affect Generation Costs
- Land-use constraints play a significant role in available land area for the development of both solar PV and wind generation and, thus, technical potential across the region.
- However, average LCOE remains relatively consistent in each country across the scenarios and is fairly independent of the land-use constraints assumed in this work.
- Other factors, such as solar and wind energy resource quality and installation costs, play a larger role in determining the estimated LCOE of projects in Southeast Asia.
What are the near-term development opportunities for solar PV?
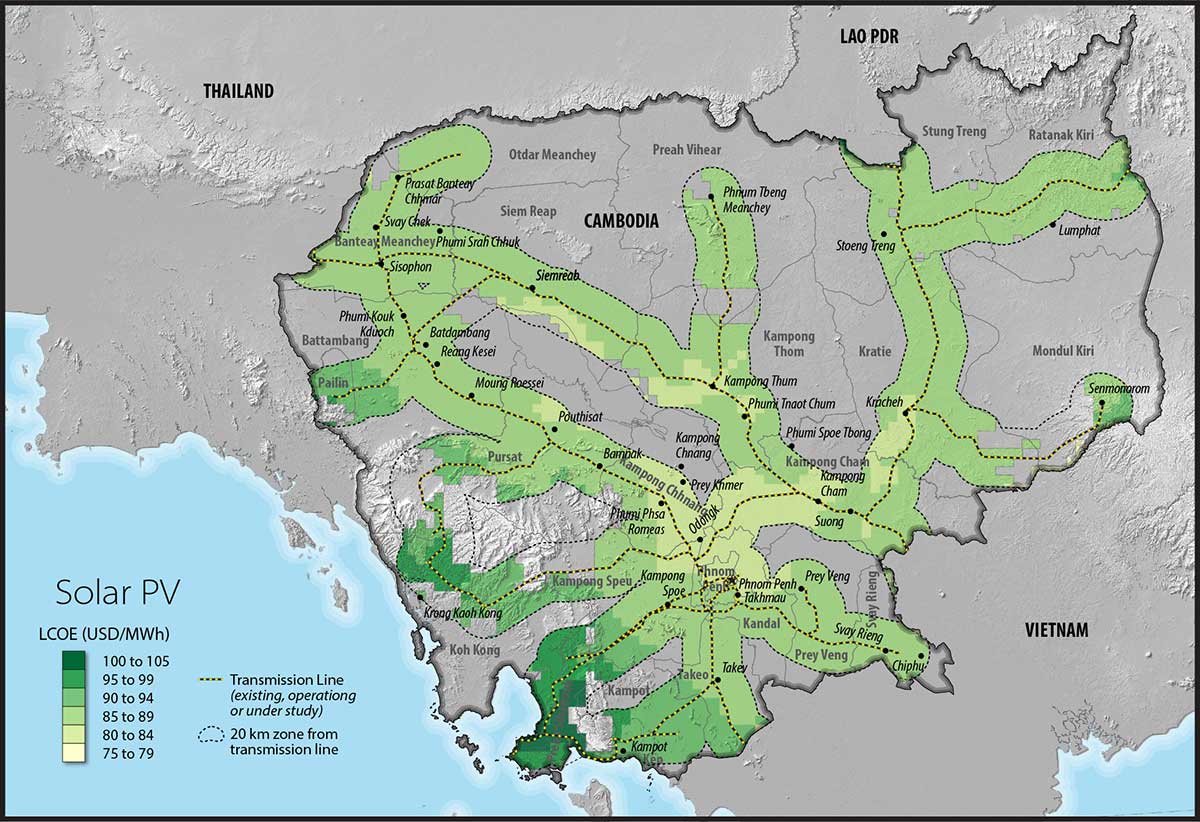
As an example application of the spatial LCOE data and complementary data sets, the near-term development opportunities for solar PV in Cambodia were explored. In this example, near-term opportunities for solar PV and wind development are based on proximity to the existing transmission system. Proximity of resources to existing transmission lines is often attractive because transmission expansion—often costly and time-consuming—can be avoided through interconnection with the existing grid. An examination of the resources in the region surrounding transmission lines provides insight into the location and estimated generation of potential short-term, cost-effective projects. This work does not consider important factors for the interconnection of these projects, such as transmission interconnection costs or the remaining transfer capacities in the existing transmission system.
To assess near-term opportunities in Cambodia, transmission system data for the country was overlaid on the LCOE results for solar PV (for the Moderate Technical Potential Scenario) to filter out any available solar resources further than 20 km from the existing grid.
Figure 10 depicts the resulting generation costs of potential near-term solar PV opportunities in Cambodia following this scenario. Near-term LCOE results range from approximately $75 USD/MWh in regions close to the capital, Phnom Penh, to approximately $105 USD/MWh along the western coast. The average cost of generation within 20 km for solar PV in this scenario is $86.7 USD/MWh. Users can click on the map below to be taken to the Cost of Energy Mapping tool to explore these costs in more detail and to further define targeted scenarios.
Figure 14. Solar PV LCOE for near-term opportunities in Cambodia (≤ 20 km of transmission and Moderate Technical Potential Scenario exclusions).
Launch the tool to do your own analysis
Key Takeaways for Near-Term Development Opportunities for Solar PV in Cambodia
- Within 20 km of the existing grid in Cambodia, there is an estimated total technical potential capacity of 2,081 MW.
- Of this total technical potential capacity, 1,901 GW has an estimated LCOE of less than $90 USD/MWh. Additional potential capacity may also be available at higher costs.
- Table 5 of the full report presents a summary of the potential suitable land area, capacity, and generation within the LCOE bands from $80 to $110 USD/MWh for this scenario.
How do installation, operation, and maintenance costs affect generation costs?
With further technology improvements and new drivers that include utility business models, competitive procurement, and implementation of best practices in project development, generation costs for renewables—including solar PV and wind—may continue to fall in Southeast Asia. These advances may lead to further decreases in both the installed costs and fixed O&M costs for renewables.
Two scenarios were developed in this report to explore the impact of reduced installed and fixed O&M costs on generation costs in Southeast Asia relative to the Moderate Technical Potential scenario base-case:
- Low Installed Cost Scenario—reflects reduced installed costs
- Low Installed Cost and Fixed O&M Scenario—considers both reduced installed and fixed O&M costs.
Representative regional solar PV and wind installed and fixed O&M costs for the year 2025 from a recent regional ASEAN renewable energy road map analysis are used for the two low-cost scenarios. These regional values were assumed for all countries as a basis to explore how LCOE may be affected by declines in installed and fixed O&M costs.
Although actual technology costs in each country and for every system will vary, these scenarios assumed flat installed costs and fixed O&M costs for each country. The Low Installed Cost Scenario assumed installed costs of $1,000 USD/kW and $1,500 USD/kW for solar PV and wind, respectively. The Low Installed Cost and Fixed O&M Scenario assumed the same installed costs for the Low Installed Cost Scenario as well as fixed O&M costs of $10 USD/kW/year and $60 USD/kW/year for solar PV and wind, respectively.
Reduced installed and fixed O&M costs for solar PV (and wind) result in lower estimated LCOEs throughout the region. Figure 11 shows the results of the two low-cost scenarios compared to the base scenario for both solar PV and wind for all countries.
Figure 15. Low installed cost and fixed O&M scenarios for LCOE compared to the Moderate Technical Potential Scenario.
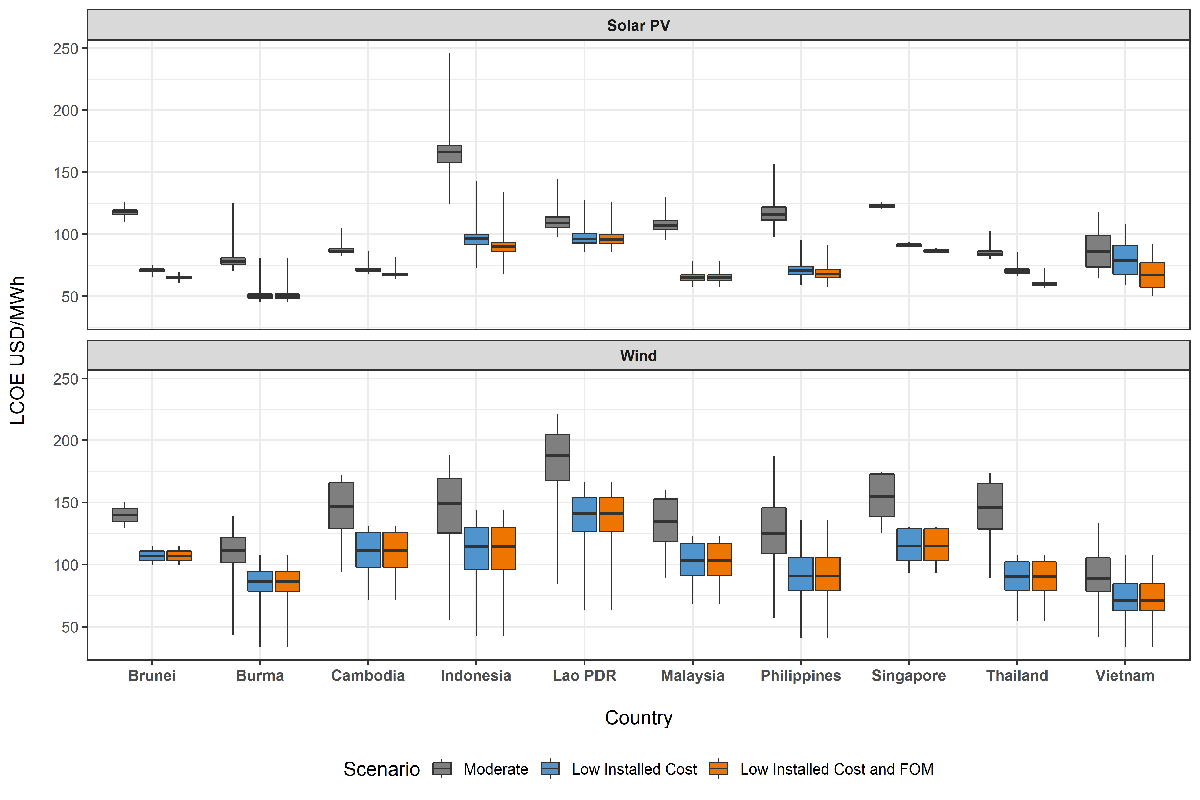
In the figure, the boxes for each scenario show the 1st quartile, median, and the 3rd quartile for the LCOE values, and the vertical lines extend to the minimum and maximum values. The Low Installed Cost Scenario for solar PV results in lower minimum, maximum, and mean LCOE values than the base-case scenario in all countries. Additionally, reducing fixed O&M costs (Low Installed Cost and Fixed O&M Scenario) results in further reducing the LCOEs relative to the base-case scenario for solar PV in the majority of the countries. Declines in LCOE from the base scenario depend significantly on the cost assumed in the base scenario for each country (see Appendix A of the full report for assumed technology costs). More significant reductions in LCOE are seen in countries with higher base-scenario installed costs, such as Brunei, Indonesia, Malaysia, and the Philippines.
Key Takeaways for How Installed and Fixed O&M Costs Affect Generation Costs
- Significant declines in the mean LCOE for solar PV and wind are seen in most countries for the reduced cost scenarios relative to the base case.
- Those countries with high installation or fixed O&M costs (e.g., Brunei, Indonesia, and the Philippines) saw the most dramatic decline in LCOE values in the reduced costs scenarios relative to the base case, whereas declines for countries with lower assumed ‘base costs’ (e.g., Lao PDR) are less dramatic.
- There is no change between the LCOE values of the two low-cost scenarios for wind as the fixed O&M values in the Base-Case Scenario were already at or below the assumed representative low-cost value for 2025 from IRENA and ACE (2016) for all countries.
How do other sensitivities affect generation costs?
Additional economic scenarios were explored in this work and the Cost of Energy Mapping Tool allows developers, planners, and policymakers to evaluate how economic indicators such as debt fraction, different depreciation schedules, and different discount-rate scenarios could affect the cost of generation in their countries for solar PV and wind.
Debt fraction
The debt fraction (or debt-to-equity ratio) is the share of capital financed with debt for generation system assets. The difference between 100% and the debt fraction is assumed to be financed with equity. For example, a debt fraction of 80% means that this share of the capital for a project was financed with debt and 20% was financed with equity.
Developers have limited capital for project investment. Reducing the share of equity required for projects potentially allows developers to invest in an increased number of power system projects (such as solar PV or wind generation) with their available capital.
The debt fraction can also be an indicator of project risk (as well as other factors) as financiers allow for a larger fraction of the project to be financed with debt, increasing the debt fraction, when there is less perceived risk in an investment. This work does not explore approaches to changing the debt fraction (or addressing project risk), which is outside the scope of this research.
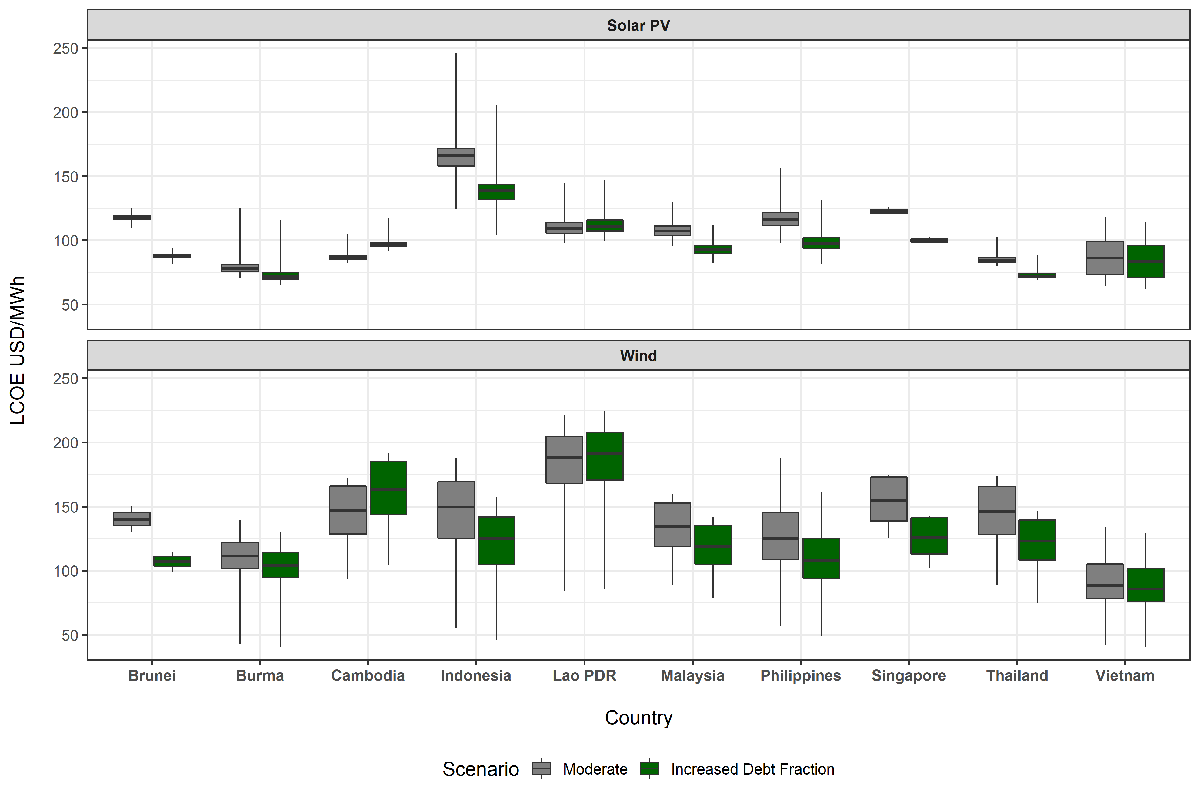
An Increased Debt Fraction Scenario, with a 95% debt fraction, was used to evaluate how this factor affects generation costs. A debt fraction of 95% was assumed to provide an example value higher than that assumed for any of the countries in the base case. For a complete list of the base-case assumed debt fractions, see Table A-5, Appendix A of the full report.
Figure 12 presents the resulting minimum, maximum, and mean LCOEs for solar PV and wind generation for both the Base Debt Fraction (the Moderate Technical Potential Scenario) and the Increased Debt Fraction Scenario. Table 7 of the full report provides details about the mean LCOE for these scenarios and the percentage change from the Base Debt Fraction Scenario.
Figure 16. LCOE for Moderate Technical Potential and Debt Fraction Scenarios.
Depreciation schedule
Alternative depreciation schedules for power system assets may impact the LCOE. Depreciation is an accounting mechanism for the reduction in value of a tangible capitalized asset over time, such as a solar PV system. Depreciation schedules break down this depreciation into a number of years and are generally associated with capital cost recovery for high-value property, such as power system assets, for accounting and tax purposes. Applicable depreciation schedules for generation system assets can vary widely between countries.
Investors typically want to write off assets (or recover costs) as soon as possible to reduce their tax liability and thus increase the profitability of these assets. Governments often offer different depreciation schedules that allow for this. Accelerated depreciation schedules are often attractive as they allow investors to reduce their tax liability sooner rather than later, while straight-line depreciation schedules often break depreciation out evenly over an assumed time period with slower, more consistent reduction in the value of assets for investors.
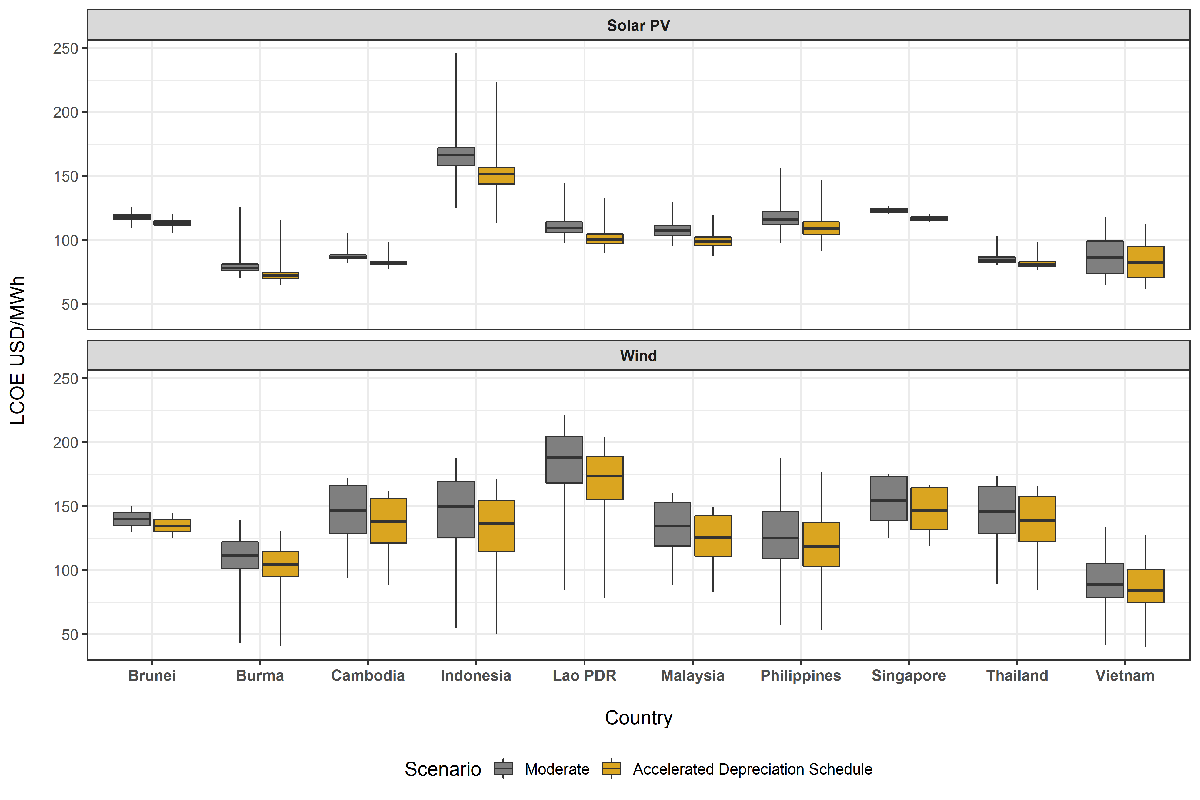
This work considers two scenarios to evaluate how an accelerated depreciation schedule may impact the cost of generation. First is an Accelerated Depreciation Schedule Scenario that is based on the 5-year Modified Accelerated Cost Recovery System (MACRS) from the United States Internal Revenue Service, as a commonly used example of an accelerated depreciation schedule. Second is a base scenario with a straight-line 20-year depreciation schedule (Moderate Technical Potential Scenario).
Figure 13 shows the LCOE results for the Base and the Accelerated Depreciation Schedules for both solar PV and wind. The accelerated depreciation schedule resulted in slight reductions in both solar PV and wind LCOEs for all countries—from a 4% reduction in Brunei to 9% in Indonesia. For more information, see Table 8 of the full report.
Figure 17. LCOE for Depreciation Schedule Scenarios.
Discount rates
Discount rates determine how long-term projects (such as power generation) are valued by investors and owners. The discount rate is a measure of the time value of money—or the value put on the time that investors waits for a return on an investment. As $1 USD (or other currency) received today could be invested to start earning interest immediately, it is worth more than a dollar received a year from now. The discount rate is used to compute present values of money becuase the value of a cash flow depends on the time when the cash flow occurs. Discount rates depend on multiple factors, including the cost of capital and inflation rates, among others. (For more information on the calculation of discount rates, see the LCOE Calculation in Appendix A-1.3.2 of the full report.)
A sensitivity analysis was performed to evaluate the effect of several discount rates compared to the base-case value in each country. The average LCOE in the Base-Case Discount Rate Scenario (Moderate Technical Potential Scenario) is compared to the average resulting LCOEs for scenarios with discount rates of 6%, 8%, 10%, and 12% for both solar PV and wind. Figure 18 shows the resulting percentage change in average LCOE from the Base Discount Rate Scenario for each of the alternative discount rate scenarios. This figure also shows how different discount rates can significantly affect the estimated average LCOE in Southeast Asia for both solar PV and wind.
Figure 18. Discount Rate Scenario Change in Average LCOE from the Base Discount Rate Scenario.
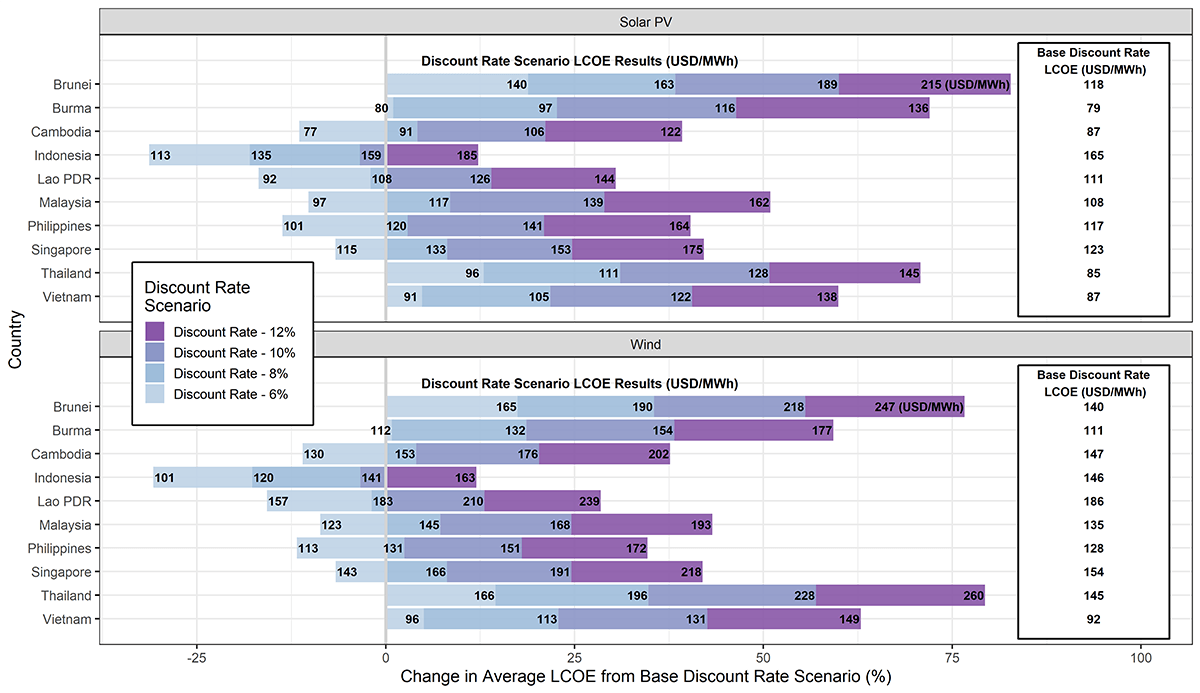
Significant variations are also seen in the resulting wind LCOEs for the discount rate scenarios. The average wind LCOE for Thailand increases from $145 USD/MWh in the base scenario to $260 USD/MWh in the 12% Discount Rate Scenario—a 79% increase from the average LCOE in the base scenario for the country. (For the assumed base discount rates for all countries, see Table A-5 in Appendix A-1.3 of the full report.)
Key Takeaways for the Impact of the Debt Fraction, Depreciation Schedules, and Discount Rates on Generation Costs in Southeast Asia
- Debt Fraction—for the majority of countries, an increased debt fraction results in reduced mean estimated LCOEs for both solar PV and wind. The impact of the debt fraction on generation costs is closely related to the assumed interest rate for the country, with higher interest rates resulting in smaller LCOE reductions (or even increases). (To see the assumed interest rates for all Southeast Asian states see Table A-5 in Appendix A of the full report.)
- Depreciation schedules—an accelerated depreciation schedule lowers LCOE for wind and solar PV for all countries in the region. Exploring accelerated depreciation schedules in countries where these may not be available could be of interest to policymakers as a tool to support lower renewable generation costs.
- Discount rates—if the rate assumed in the Discount Rate Scenario is greater than the rate in the Base-Case Scenario, the average estimated LCOE increases. Alternatively, the estimated LCOE decreases where the discount rate assumed in each scenario is less than the Base-Case Scenario rate. An understanding of how the discount rate impacts the LCOE may help decision-makers in exploring financial mechanisms to make renewables more competitive, such as lower interest rates.